Hello Visitor! Log In
Income Distribution and Social Policy: Relevance for the Social Dimension of Sustainability
ARTICLE | October 12, 2019 | BY Estelle Herlyn, F. J. Radermacher
Author(s)
Estelle Herlyn
F. J. Radermacher
 Get Full Text in PDF
Abstract
This publication provides clues to the phenomenon of increasing social division within rich societies. At the same time, it refers to more recent insights of a partly empirical, partly mathematical type, which make it possible to describe the income situation of mature states/market economies solely by means of the so-called Gini coefficient. The Gini coefficient is the most important parameter for describing inequalities. The fact that it can fully describe the situation in the case of income distribution is both surprising and practically helpful. The present paper also refers to some consequences of the analysis of income distributions for the interpretation of political processes. It also provides information on the so-called “efficient inequality range”. This describes the spectrum in which balance or inequality has a positive effect on societies. A variety of further details on the issues addressed can be found in the references given, in particular [4, 6, 9].
1. The Increasing Social Divide
In recent years, an increasing social divide or a widening gap within states has been observed worldwide, increasingly in Europe. This is problematic. On the one hand, there is the danger of a high level of dissatisfaction among more and more citizens, which can “go beyond” democracy—Brexit and the new policy of the USA are mentioned here as examples. There is also a second aspect: the efficiency of states decreases when their income distribution falls outside the so-called “efficient inequality range” (Gini values between 0.25 and 0.35). One of the reasons for this is that if there is too much inequality, the potentials (intellectual,
“If there is too much inequality, the potentials (intellectual, motivational, entrepreneurial) of people cannot be fully achieved and, on the other hand, if there is too much equality, the incentive structures for contributions of all kind are too weak.”
motivational, entrepreneurial) of people cannot be fully achieved and, on the other hand, if there is too much equality, the incentive structures for contributions of all kind are too weak.
Too much inequality (Gini values above 0.35) as well as too much “egalitarianism” (Gini values below 0.25) therefore tend to harm society [1]; When the gap rises, there is a steady increase in inequality (increase in the Gini value), which is the acute problem today, following the end of Communism. This process threatens sustainability from the social side [1, 2]. The protests of the “gilets jaunes” (yellow vests) in France make the problems clear. They also show that a solution to the environmental problems at the expense of the socially weaker sections of the population will meet with massive resistance if the solutions are perceived as unfair. In this context it is interesting and remarkable that at meetings of the World Economic Forum in Davos in 2017 and 2018, increasing division in the social sphere was identified as one of the greatest risks for open societies and our economic system.
2. Causes
How does increasing inequality come about? After the Second World War, the situation in today’s OECD countries was different. There was strong economic growth, almost everyone was able to participate. One of the main reasons for the change in the situation since then is the increasing concentration of wealth. If wealth gains too much weight in relation to value added per year, and if wealth is also distributed very unevenly, this inevitably results in increasing inequality of income, because the high income from capital income, which is concentrated with the few, increases the “imbalance” of income distribution. Such a development is exacerbated by a positive correlation between asset size and (percentage) achievable returns. With growing wealth, therefore, ever greater returns tend to be achieved, not only in proportionally large amounts but even in disproportionately large ones. This is then exacerbated by the comparatively low taxation of capital gains. In addition, there are numerous possibilities for the owners of such assets to almost completely evade the taxation of high capital gains in the context of globalisation. These topics are impressively presented in Thomas Piketty’s book “Capital in the 21st Century” [8]. A further problem is added today, namely the partial undermining of democracy by globalisation and thus the undermining of its ability to correct such imbalances, which results in a starting position that is unfavourable for more equalisation and makes it difficult to correct conditions (the so-called “trilemma of globalisation” [11]).
3. Position of the OECD on the Topic
The OECD, the Organization of the Rich Countries, has systematically and regularly addressed the problem of the widening gap since the global financial crisis, and has several times sent reports on this issue, e.g., to the German government. The IMF and the World Bank now argue similarly [5, 12]. This aspect is also addressed in a new publication by the Club of Rome, with a view to the possible achievement of the Sustainable Development Goals (SDGs) by the international community [10].
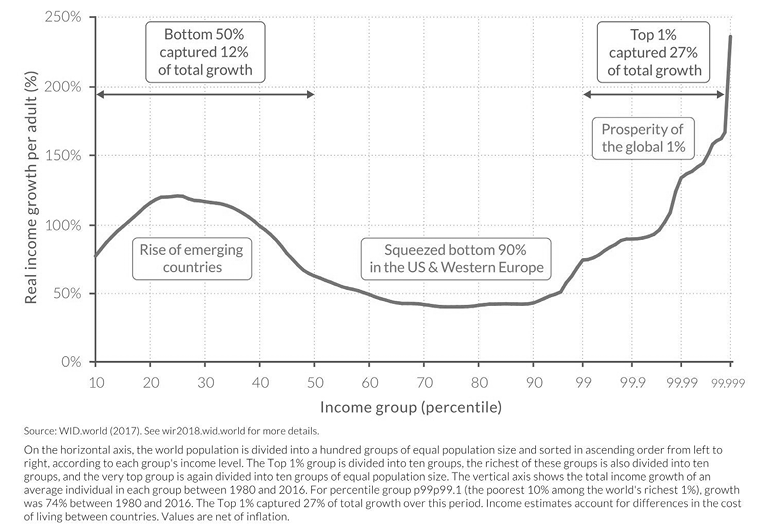
One of the reasons for the increasing difficulties in these areas is the presence of supranational treaties (e.g. the WTO treaties), with the help of which the possibilities
of democracy to intervene effectively in factual issues are reduced. Today, for example, the provisions of the WTO treaty make it impossible for states to promote sustainability-compliant corporate behaviour along international value chains. Such a situation is also called an “emptying of democracy”. In the current public discussion, it is finally also made clear that this does not necessarily contradict the fact that, in the sense of the Ricardo theorem, an expansion of open trade increases the total “cake” available. The following has happened: Many have fallen behind, while the GDP has increased, whereby others have profited doubly: they have allocated for themselves entire growth and additionally the reduction volume of the others. The phenomenon is plastically evident in the so-called “elephant curve” (Figure 1), which shows that in relative terms the income of many former poor people has risen significantly over the past few decades (prototypically the Chinese industrial worker), while in the middle class of the rich world many (prototypically simple industrial workers and/or the lower middle class in the USA) have suffered losses in prosperity.
4. Effects on Democracy
All this also has repercussions on the functioning of a democracy, or more precisely, on potential majority formations. With increasing inequality in income distribution, the income shares of the middle class shift towards the top. So, at some point there will be a redistribution of income from the middle to the rich, since starting from an income distribution, as is currently to be found in many OECD countries, there is little to be “fetched” from the poor for the rich. Volumes in the upper income segments are thus growing due to the deterioration of the situation in the middle. This is an adjustment of the income distribution “upwards”.
“New political alliances and new elements of regulation are needed if the emerging problems are to be solved.”
Politically, such a situation results in problems in creating democratic majorities in favor of the top against the interests of the middle class and ultimately of society as a whole. In this situation, the upper layer can seek populist alliances with the poorer segment of society. In a distant analogy this is reminiscent of “bread and games”. Recent developments in the USA point in this direction. Analyses show increased movements in this direction as soon as societies move out of the Efficient Inequality Range in the direction of too much inequality [2, 6]. Such movements are now beginning to emerge in some OECD countries.
5. Foreseeable further aggravations in the context of Digitisation and Artificial Intelligence
Current developments in the fields of digitisation, artificial intelligence, analytics and big data, which “threaten” millions of jobs of well-educated and well-paid people, can further accelerate this trend and thus result in the “bleeding out” of the centre and potentially threaten the stability of our social systems [3]. The unconditional basic income often mentioned in this context does not provide any real remedy at this point. Rather, it cements the way to a two-tier society. In its place, high transfer payments would have to be provided in the event of massive job losses if highly qualified people make important contributions to society, even if these services are not provided in the area of economic processes. New political alliances and elements of regulation are needed if the emerging problems are to be solved.
6. Mathematical Tools for analysing the situation [4]
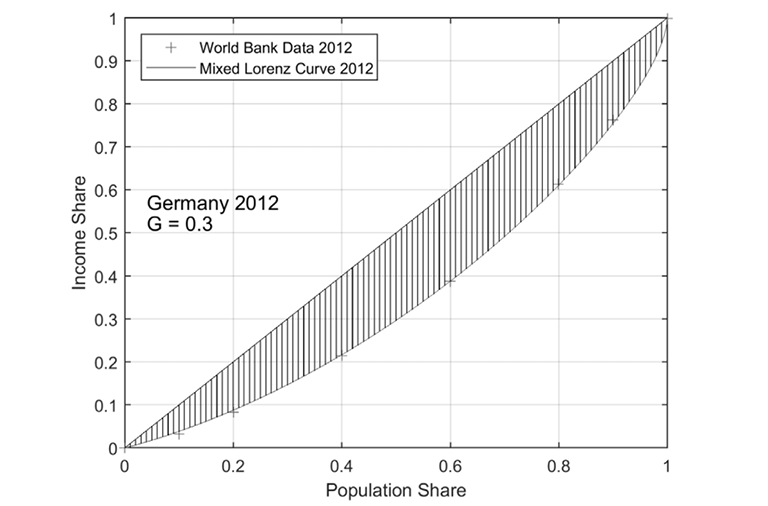
In recent years, the authors have achieved profound mathematical insights and developed powerful tools that provide new insights into the topics under discussion, resulting from projects financed by the Vector Foundation, Stuttgart. These insights provide interested economists and social scientists with new opportunities for conducting their own scientific work on the topic, which is why we refer to them here [4, 9]. The insights refer to the so-called Lorenz curve of income distribution and its associated Gini value. The Lorenz curve accumulates the incomes arranged according to increasing size. The total income is standardized to 1. The Lorenz curve for Germany 2012 can be found in Figure 2. Such a Lorenz curve leads to the so-called Gini coefficient, which twice represents the area between the Lorenz curve and the main diagonal (hatched area in Figure 2). In the case of equal income distribution, the Lorenz curve coincides with the main diagonal and the Gini value is then 0. In the case of the greatest possible inequality, the Lorenz curve essentially coincides with the x-axis (except for the value 1 in point 1). The Gini value is then 1.
The new contribution to the topic described is the following insight, which has partly an empirical, partly a mathematical character: It is possible to deduce from a given Gini value Ԍ, as published for example by the World Bank or the EU, the actual distribution of income with normalized total income 1 (so-called standard income Lorenz curve LԌ ). This is highly noteworthy because in general applications (e.g. when describing the distribution of sales volumes to corporate customers via a Lorenz curve) one cannot usually deduce the distribution from the Gini.
In the case of income distributions of “mature” states or economies, this is different. Here, there is a highly accurate 1-1-1 match between the income distribution, the quantiles of the World Bank data set and the respective Gini. The standard form L found by the authors is of the type L = 0,6 • Pareto (ɛ) + 0,4 • Polynomial (ɛ), where Pareto (ɛ) or Polynomial (ɛ) are the Pareto or Polynomial Lorenz curves known in the literature for a parameter ɛ to which ɛ = (1 − Ԍ)/(1 + Ԍ) and Ԍ = (1 − ɛ)/(1 + ɛ) applies. Details and descriptions of the mentioned results can be found in [4, 9]. This includes an insight referring to a property called self-similarity of the Pareto and Polynomial Lorenz curves that characterizes these two types of distributions exclusively, adding considerably to our understanding why the given 1-1-1 relationship exists.
The following table shows for a number of examples (countries and years) the high agreement between the values given by the World Bank data (10%, 20%, 40%, 60%, 80% and 90% quantiles) and the corresponding values of the standard approximation and the Gini. This is done in the sense of the root of the mean square deviation (RMSE/6) weighted by data points, which is extremely small (see [7]).
Table 1: Approximation of World Bank Income Data using the standard Lorenz curve for different countries and years. Regarding the approximation quality refer to [4]
|
Country |
Year |
RMSE Standard LC |
|
Argentina |
2015 |
0,0119 |
|
Brazil |
2015 |
0,0067 |
|
Mexico |
2015 |
0,0131 |
|
Poland |
2015 |
0,0031 |
|
Ukraine |
2015 |
0,0018 |
|
Indonesia |
2014 |
0,0091 |
|
Iran |
2014 |
0,0019 |
|
Russia |
2014 |
0,0036 |
|
Turkey |
2014 |
0,0042 |
|
United States |
2014 |
0,0099 |
|
China |
2013 |
0,0067 |
|
France |
2013 |
0,0034 |
|
United Kingdom |
2013 |
0,0076 |
|
Italy |
2013 |
0,0106 |
|
Norway |
2013 |
0,0069 |
|
Austria |
2013 |
0,0083 |
|
Sweden |
2013 |
0,0083 |
|
Spain |
2013 |
0,0146 |
|
Germany |
2012 |
0,0046 |
|
India |
2012 |
0,0116 |
|
South Africa |
2012 |
0,0084 |
|
Australia |
2011 |
0,0059 |
|
Canada |
2011 |
0,0066 |
|
Nigeria |
2010 |
0,0037 |
|
Japan |
2009 |
0,0073 |
If the total income level is known, the distribution of absolute incomes can be derived from the Ԍ Lorenz curve. If we also know the number of people, we also know the distribution of absolute incomes within the population. As derivative L′ from LԌ one obtains the distribution of the relative individual income level, as a difference function LԌ1− LԌ2 the so-called loss function, which indicates the change in the relative individual income level, if the level of income compensation in a country changes from a Gini value G1 = (1 − ɛ1)/(1 + ɛ1) to a Gini value Ԍ2 = (1 − ɛ2)/(1 + ɛ2). The study of the course of loss functions as a function of Ԍ1 and Ԍ2 (or the corresponding values ɛ1 and ɛ2) provides deep insights into groups of winners and losers concerning changes in the income distribution of a society and leads to resulting phenomena in the area of political coalition formation and restrictions in the enforcement of majority decisions. More on these important topics can be found in [2, 4, 6]. The concluding example in Figure 3 shows the phenomena that can be analysed here, because the standard Lorenz curve is a mathematical instrument whose sharpness of detail goes far beyond the potential of World Bank data or even (only) the Gini.
Table 2: Top 10% and 20% of income shares for different Gini indices
calculated from the standard Lorenz curve.
|
Gini |
Respective ɛ |
Top 20% income share |
Top 10% income share |
|
0,25 |
0,60 |
35,3% |
21,5% |
|
0,30 |
0,54 |
38,7% |
24,4% |
|
0,35 |
0,48 |
42,6% |
27,8% |
by one percent of the Gini index towards higher inequality.
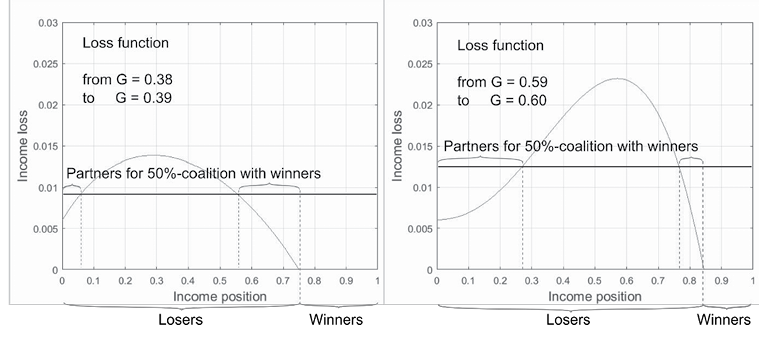
Figure 3 shows the following: If the income inequality given by a Gini index of Ԍ = 0.38 is increased by the 0.01 higher value Ԍ = 0.39, then the income winners are the group with the 24% highest income. The 50% strong group with the highest income losses lies in the segment of 6% to 56% high incomes. Losers with lower income losses are the poorest 6% and the neighbouring group of the winners between the income positions 56% and 76%. If a 50% majority is sought for increasing inequality from Ԍ = 0.38 to Ԍ = 0.39, the latter two groups are the most favourable allies of the “winning segment” in terms of cheap compensation options (for the resulting loss of income due to this measure). The opposite side, the opposition to such a measure, is then the 50% in the 6% to 56% income range. The graph on the right can be read analogously to this, whereby the profiting segment is smaller here and the income losses overall are higher. The potential allies of the winning segment for such an increase in inequality are increasingly in the low-income bracket. This situation corresponds to the above-mentioned scenario of populist alliances in the sense of the analogy “bread and games”.
References
- Alvaredo, F., Chancel, L., Piketty, T., Saez, E., Zucman, G.: World Inequality Report 2018. Belknap Press of Harvard University Press, 2018
- Herlyn, E.: Einkommensverteilungsbasierte Präferenz- und Koalitionsanalysen auf der Basis selbstähnlicher Equity-Lorenzkurven – Ein Beitrag zu Quantifizierung sozialer Nachhaltigkeit. Springer Gabler Publishers, 2012
- Herlyn, E., Kämpke, Th., Radermacher, F. J., Solte, D.: BIG DATA and Analytics – What are the perspectives? Reflections on the OECD-Project “The Role of Data in Promoting Growth and Well-Being”, 2015
- Herlyn, E., Radermacher, F. J.: Lorenzkurven und Gini-Index im Bereich der Einkommensverteilung – Neue inhaltliche Einsichten. Report to the Vector Foundation, 2017
- International Monetary Fund: How to operationalize inequality issues in country work. International Monetary Fund, Washington, D.C., 2018
- Kämpke, T., Radermacher, F. J.: Income Modeling and Balancing – A Rigorous Treatment of Distribution Patterns. Springer Publishers, 2015
- Orthen, T.: The Mixed Lorenz Curve: Parameter Studies to Model World Bank Income Data. FAW/n Working Paper, September 2018
- Piketty, Th.: Capital in the Twenty-First Century. Harvard University Press, Cambridge, MA, 2014
- Radermacher, F. J., Estelle H. (2018). A 1-1-1 relationship for World Bank Income Data and the Gini. Working Papers 473. ECINEQ, Society for the Study of Economic Inequality. URL: https://ideas.repec.org/p/inq/inqwps/ecineq2018-473.html.
- Randers, J., Rockström, J., Stoknes, P. E., Golüke, U., Collste, D., Cornell, S. (2018): Transformation is feasible - How to achieve the Sustainable Development Goals within Planetary Boundaries (a report to the Club of Rome, for its 50 years anniversary). Stockholm Resilience Centre, 2018
- Rodrik, D.: The Globalization Paradox: Democracy and the Future of the World Economy. W.W. Norton, New York and London, 2011
- World Bank: Poverty and Shared Prosperity 2016: Taking on Inequality. World Bank, Washington, D.C., 2016
About the Author(s)
 |
Estelle Herlyn Professor & Head, Competence Centre for Sustainable Development, FOM University of Applied Science, Germany |
 |
F. J. Radermacher Head, Research Institute of Applied Knowledge Processing /n (FAW/n), Germany; Fellow, World Academy of Art & Science |
